Highstate Dashboard
VMware
The Highstate dashboard is a feature that help IT Admins view changes and compliance issues across all managed machines in one place.
Role: Designer, Co-lead
Time frame: 2 weeks
The Goal
Create a dashboard for IT admins to see changes, drifts, and errors in their managed machines.
Challenges
Fast Timeline
The initial design and prototype for this was done for an “Innovation Sprint” which meant that the other designer and I had only 2 weeks to put this together.
Showing What’s Most Important
Users have specific things they’re looking for in a job or state return. They often have to dig through layers of information to find it. We surfaced changes and errors to the top to eliminate the need to search.
Different Ways to View Information
Users may want to view results by state so they can see which states are failing most often, or by minion to see which machines are failing most often.
Design Process
Design
Led workshops with design, engineering, and product mgmt
Worked with engineering team to bring the design to life
Validation
Put together initial designs to demo for the innovation sprint
Planning and Delivery
Worked with technical account managers to get quick feedback
Presented to and got feedback from VMware executives
Design
The feature was designed to provide visibility into machine compliance with the user’s Highstate file. This first screen shows the top level, which is the dashboard. In the dashboard you can see changes or errors when running Highstate on minions (machines), or by state (individual pieces of the Highstate file).
This screen shows the next level at which we wanted to show Highstate summaries, which is for targets. Targets are groups of minions based on customer-specified criteria. So if you had a target for only “CentOS” machines, then you could see a Highstate summary for all CentOS machines.
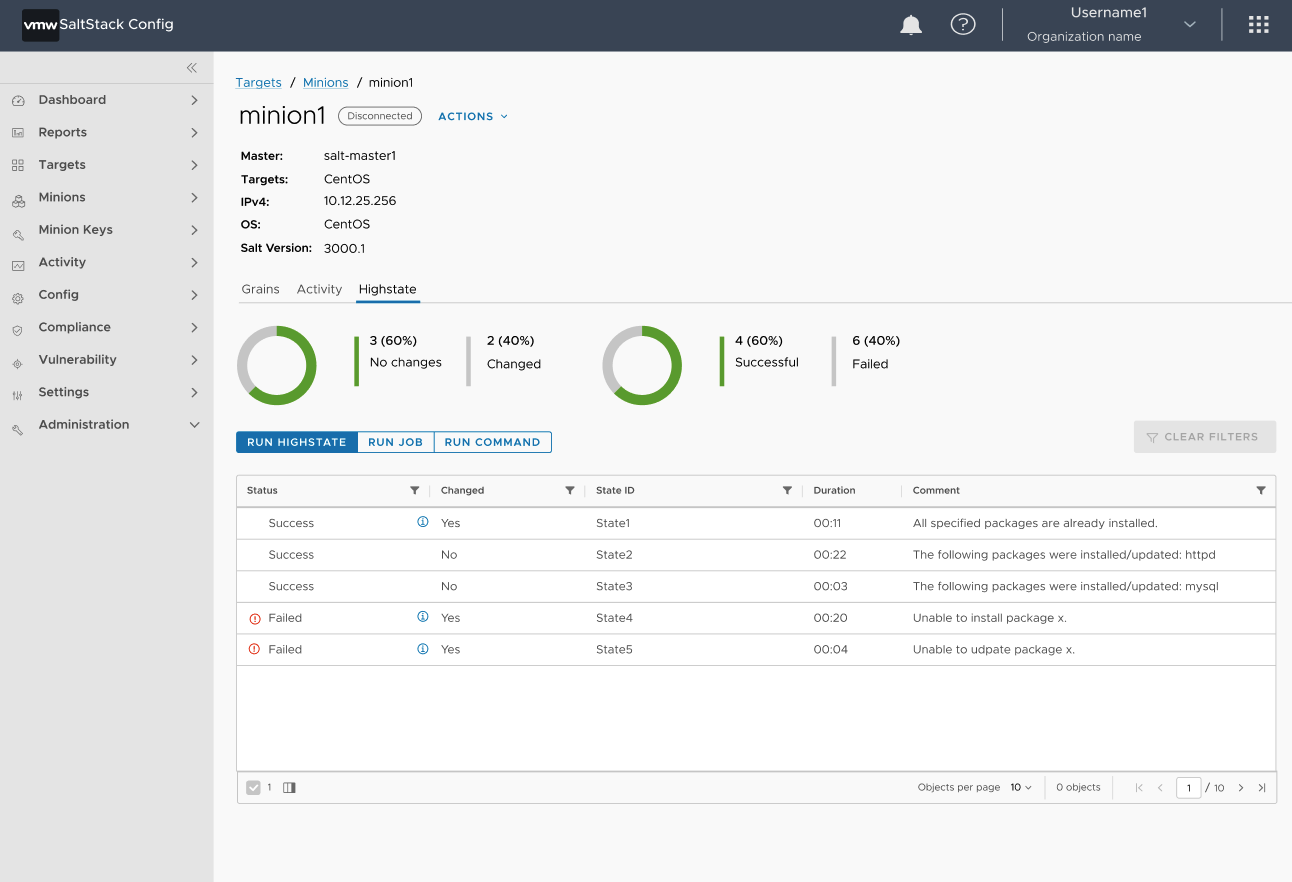
The last level we wanted to show this on was the individual minion level. A minion is an agent installed on managed machines to pull information about the machine or push / enforce a specific state. This can give you a good idea of the compliance history of the machine.
Validation
For initial validation, we worked closely with technical account managers (TAMs) to make sure we were surfacing the right type of information to make things much easier for our users. The next step was to present to several executives, including the VP of engineering and CTO. Presenting went so well that this project won the innovation sprint and we were able to build it out.
“This Highstate visualization is AMAZING, it is something I have wanted to see since day one. This is how it should have always been!”
-Tom Hatch (creater and former CTO of SaltStack)
Planning and Delivery
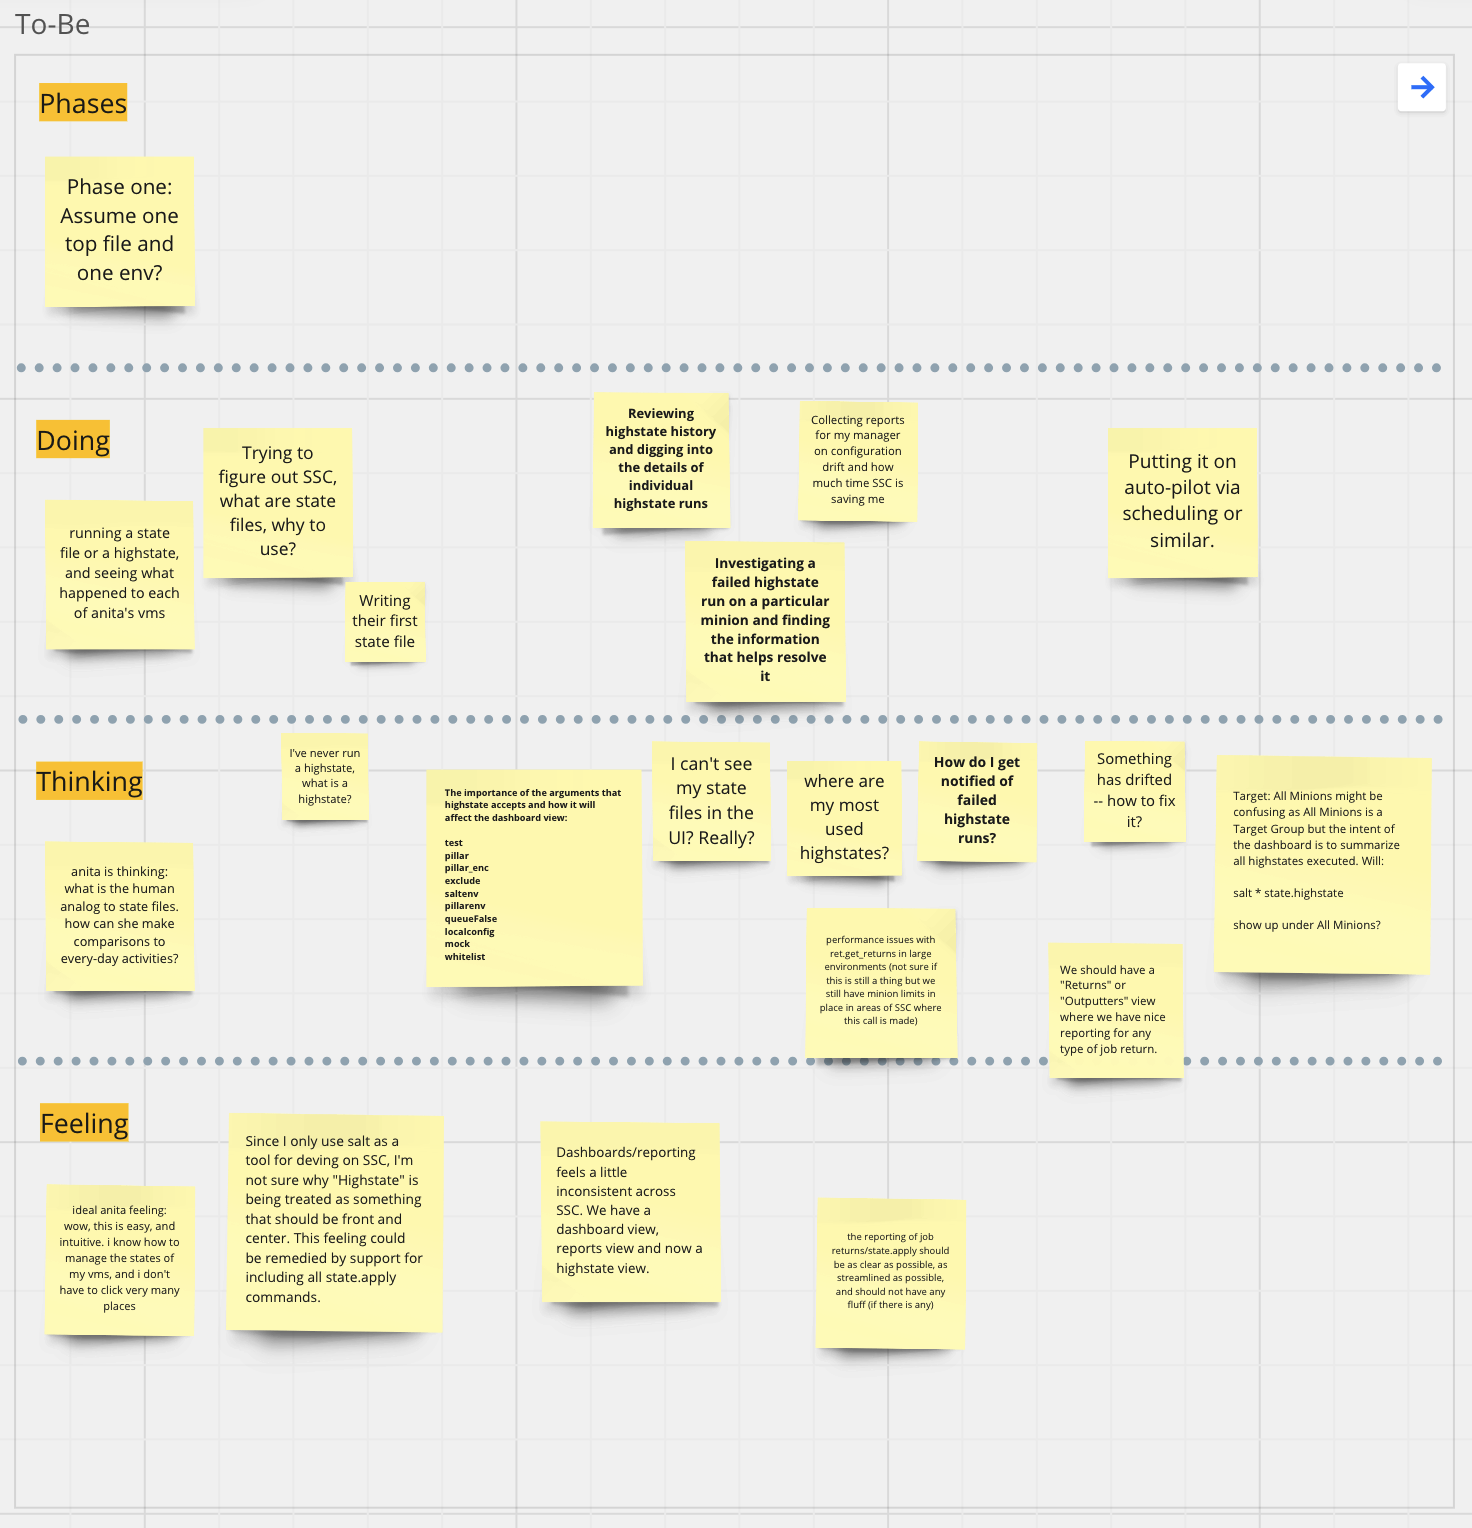
One of our first steps when planning the feature implementation with the engineering team was creating an empathy map.
The idea is to help everyone on the team align to our user’s goals and what they might be doing, thinking, and feeling through the process today vs in an ideal world.
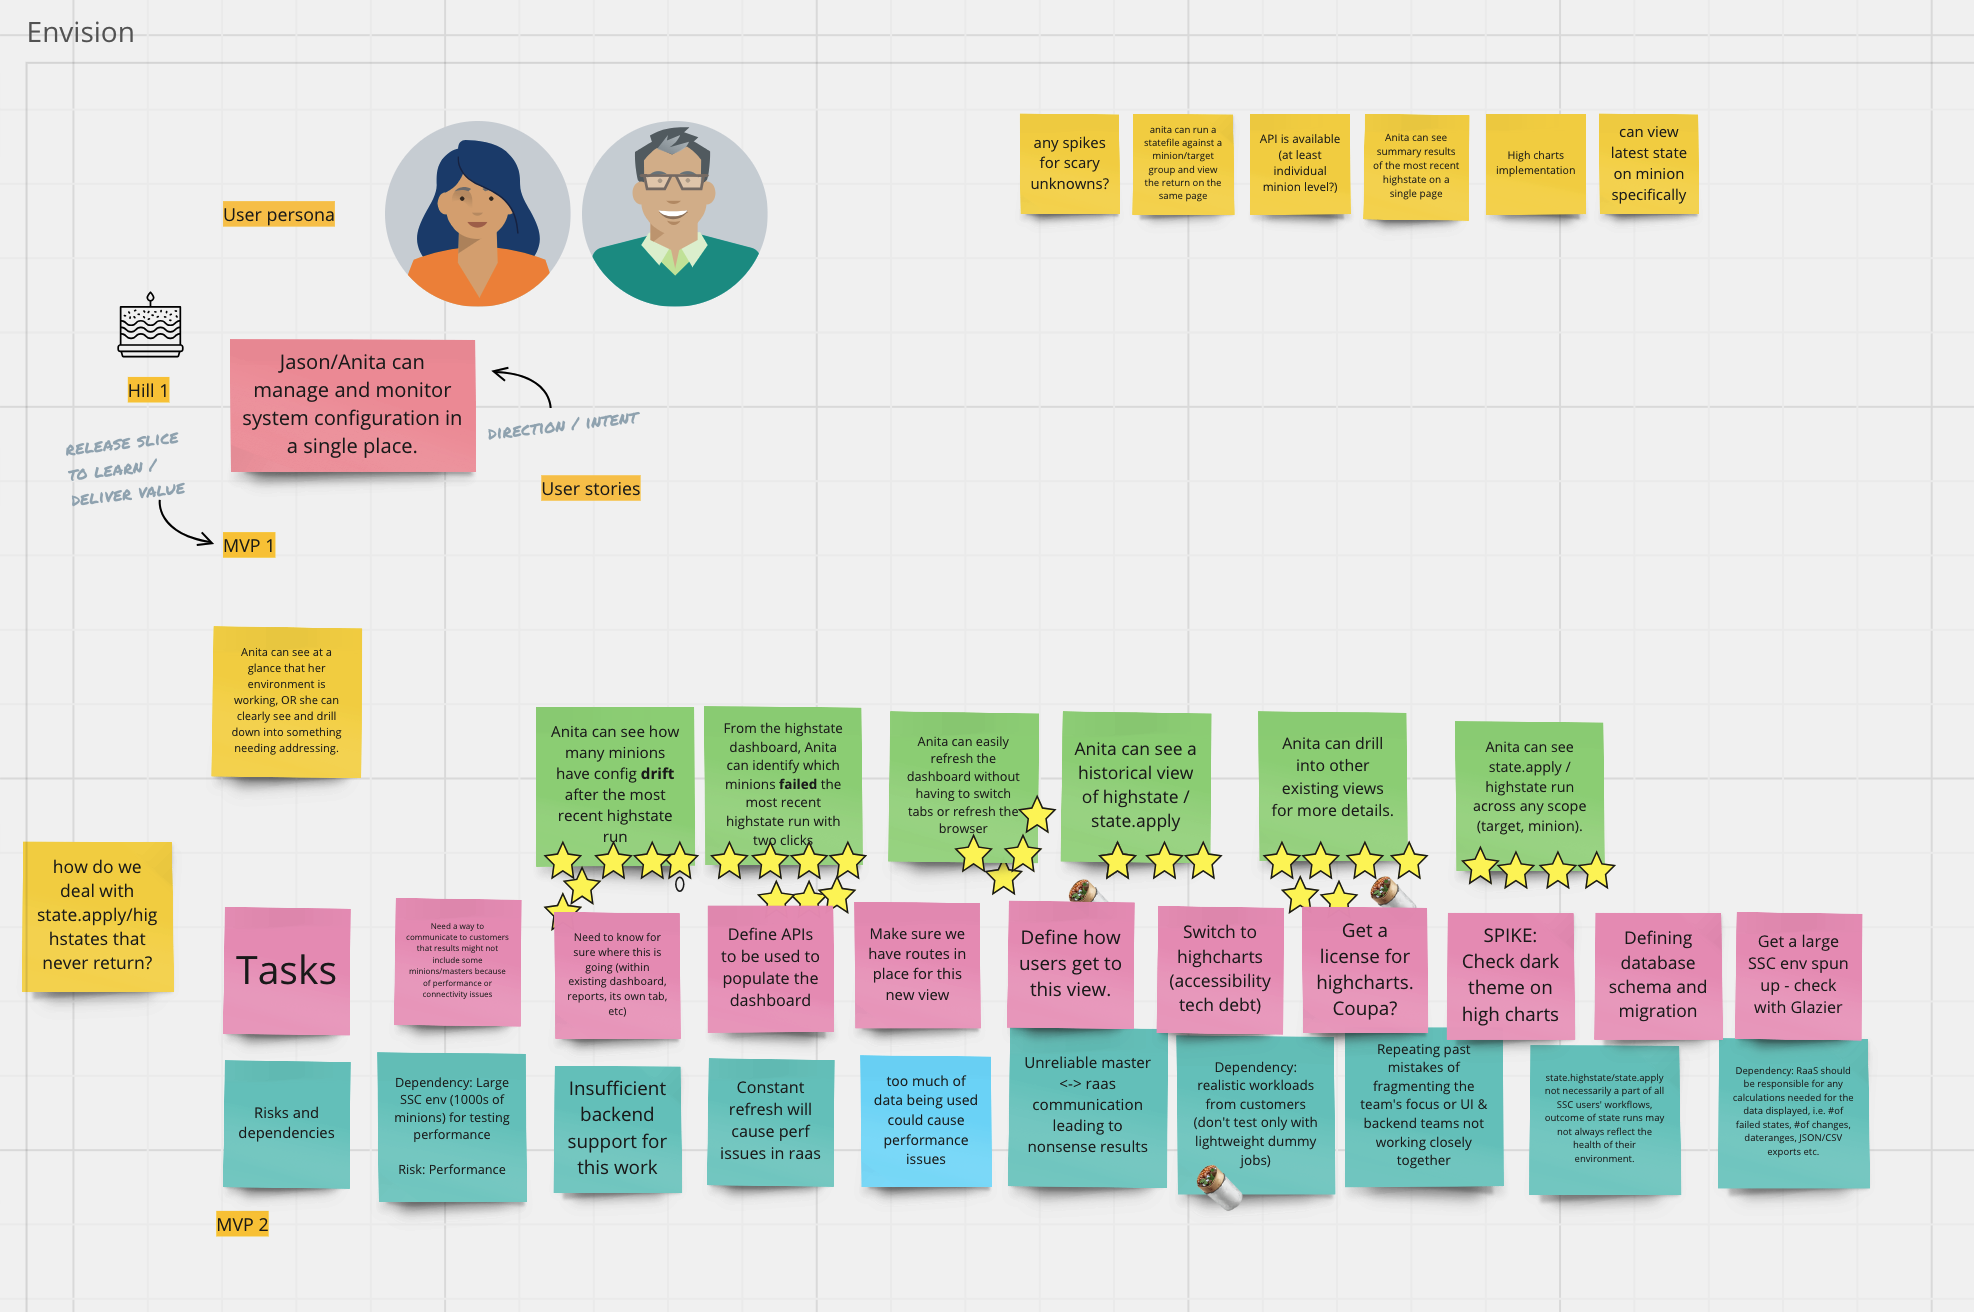
The next phase of planning was to identify our questions and assumptions to try and get ahead of issues that might come up.
Last, we needed to break each user goal into reasonable tasks, also identifying potential risks and dependencies.


